The Anaplan Project Portfolio Management application allows you to effectively manage an entire portfolio of projects.
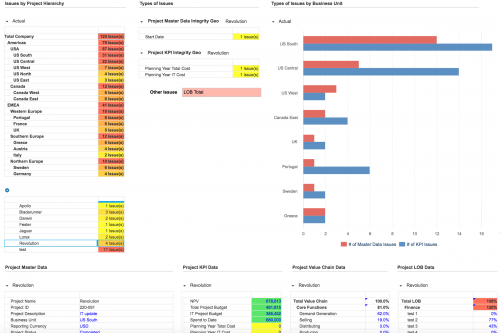
In large-scale organizations, the IT function manages hundreds or thousands of projects every year, facing data integrity, aggregation and reporting challenges to monitor and analyze their project KPIs across multiple dimensions.
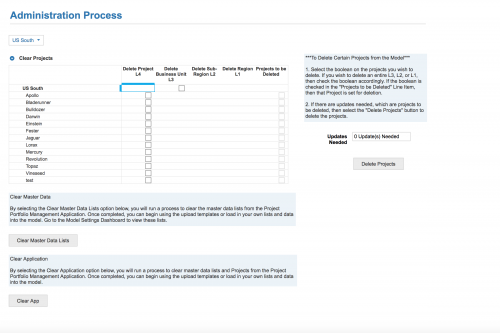
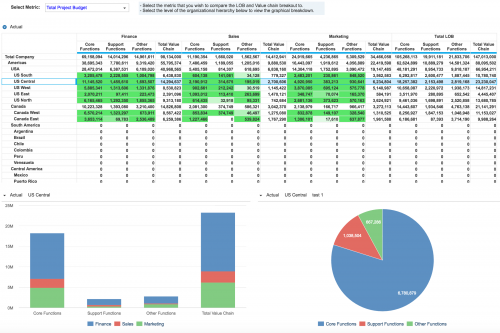
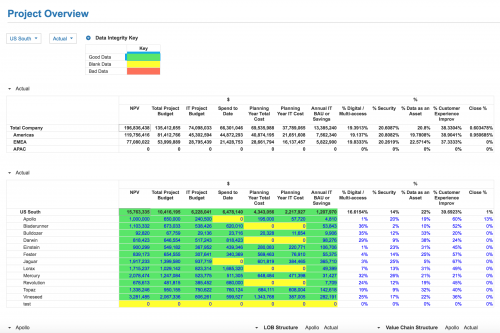
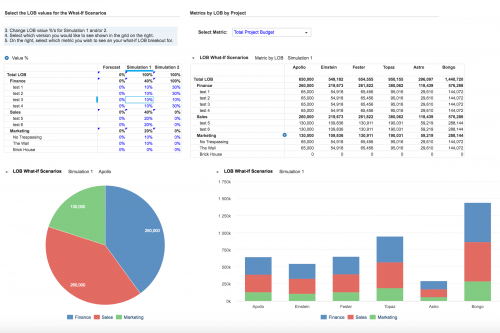
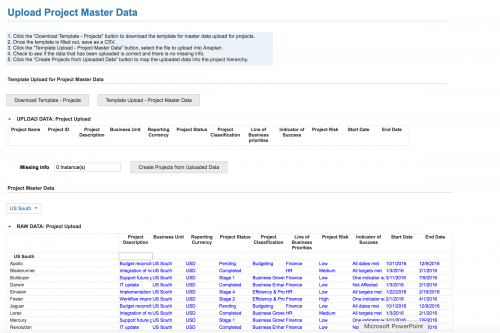
Use the Anaplan Project Portfolio Management application for automating data collection, providing data quality checks, analyzing project KPIs across entities, geographies, lines of business or functions in dashboards and running what if scenarios.
Upload your personal project data into the app with an easy-to-follow template download and upload process as an end-user.
View all project metrics and attributes on a single dashboard with bad and blank data highlighted.
Reconcile all data and metrics integrity once your projects are uploaded into the app with no additional setup required.
Analyze all metric breakdowns by their LOB and value chain relationships in one easy-to-follow dashboard.
Create on-the-fly what-if scenarios that can be easily customized with no additional setup.
Clear individual projects or all information from the app by running a simple action.
Information
App Last Updated
January 19th, 2017
Size
49.6 MB
Language
English
App stats
Modules
48
Roles
4
Formulas
294
Reports
17
Complexity
Advanced
Features
Ease of data import
Using pre-mapped templates, getting your data into the app takes no extra back-end effort. All master data and data can be imported automatically by an end-user by filling out the templates and uploading them back into Anaplan
Fully configurable templates to monitor your KPIs
Upload KPIs and metrics that are specific to your projects by quickly editing the names before downloading the template. The Anaplan templates to monitor your project KPIs are fully configurable.
Ensure Project Data Integrity
Once your data is in the app, Project integrity reports are created on-the-fly allowing to quickly identify any inconsistent or missing data in the app.
Metric Breakouts by Value Chain and Line of Business
View your customized project metrics by lines of business and value chain breakout based on their geo hierarchy all within one dashboard.
What-If Scenarios
Choose the projects that you wish to view in your what-if scenarios as an end-user and see them be added to the dashboard in real-time. Create up to three what-if scenarios for your LOB breakouts and view this breakout by all your metrics being used within the app.