This learning model example teaches model builders how to add the Dynamic Charting functionality to their models.
This model example is showcase the art of the possible. Our configurable Application found here are fully supported and accelerates your journey to the connected enterprise.
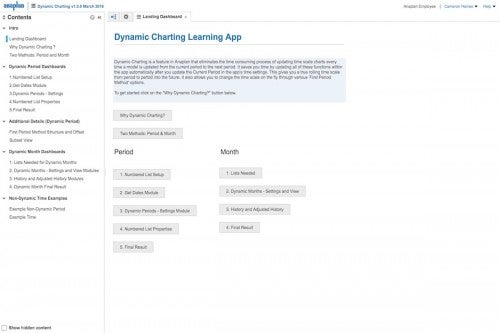
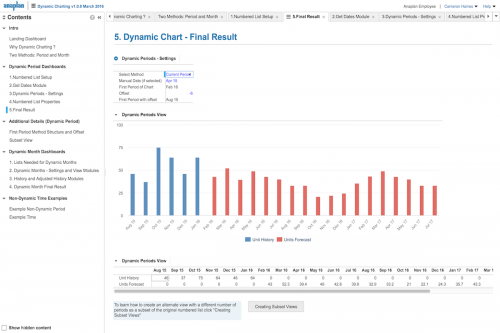
Dynamic Charting is a feature in Anaplan that eliminates the time consuming process of updating time scale charts every time a model is updated from the current period to the next period. It saves you time by updating all of these functions within the model automatically after you update the Current Period in the model's time settings.
This gives you a true rolling time scale from period to period into the future. It also allows you to change the time scale on the fly through various 'First Period Method' options.
Features
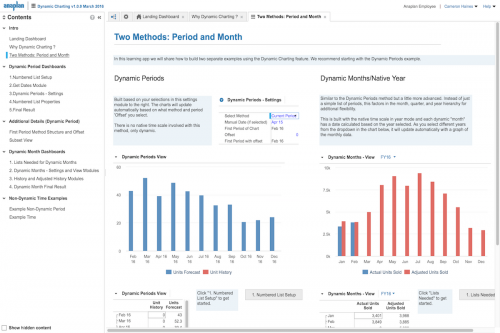
Dynamic Periods
- There's no native time scale involved with this method, only dynamic.
Dynamic Months/Native Year
- Similar to the Dynamic Periods method but a little more advanced. Instead of just a simple list of periods, this factors in the month, quarter, and year hierarchy for additional flexibility.
- This is built with the native time scale in year mode and each dynamic "month" has a date calculated based on the year selected. As you select different years, it will update automatically with a graph of the monthly data.
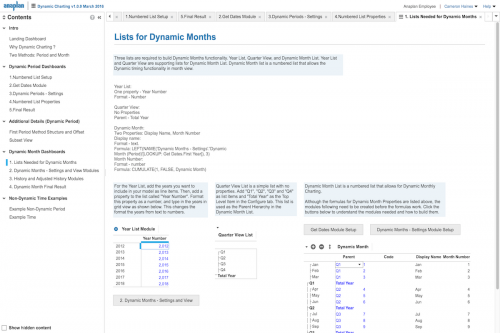
- Step-by-step instructions on how to build the numbered list that will be used as the Dynamic List.
- Step-by-step instructions on what modules are needed to make dynamic charting work and how to build them.
Information
Size
1.6 MB
Stats
Modules
17
Roles
3
Formulas
43
Reports
N/A
Complexity
Beginner
termsTitle

