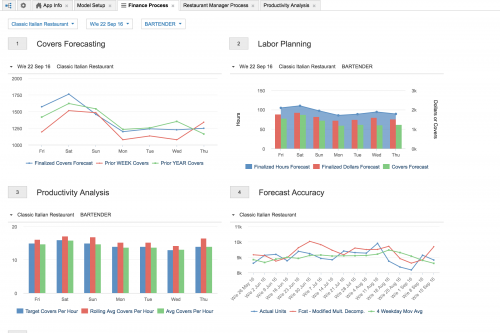
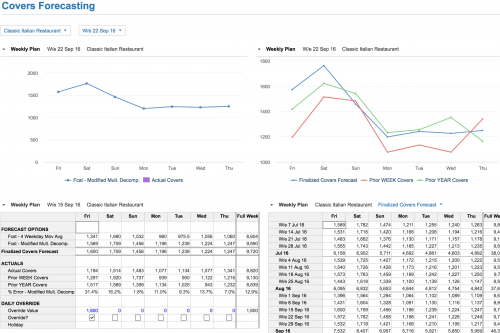
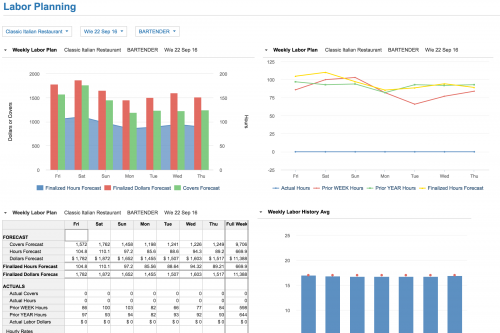
Leveraging predictive analytics, we forecast the main drivers of your restaurant labor. Then, using these drivers, a daily and weekly covers and sales forecast is created.
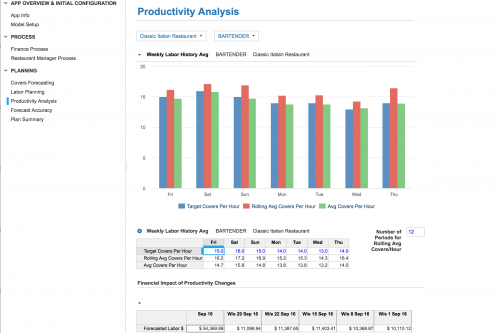
Gain greater analysis in what are your productivity and labor rates are for each job. This allows you to create an accurate labor, and sales plan at both the weekly and daily level.
Information
Size
162.1 MB
Language
English
Stats
Modules
25
Roles
3
Formulas
154
Reports
10
Complexity
Intermediate
Features
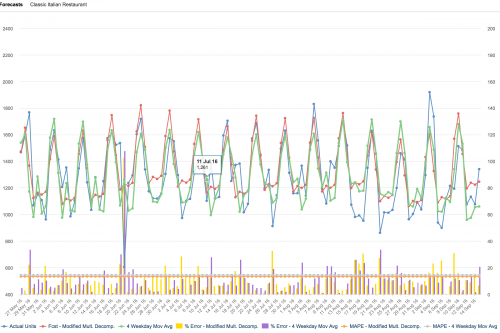
Weekly time-series forecasting methods.
- Using historical metrics and forward-looking predictive analytics, you gain greater insight into your sales patterns down to the daily level.
Create daily covers forecast
- Leverage forecasting calculations to create a daily/hourly labor plan for your restaurants down to the job role level.
Override and Adjust
- Manually override covers or sales based on holidays and special events to create a forecast that's unique to your restaurants.
Collaborate across business units
- Set productivity rates collaboratively across finance, and store operations to get to a detailed forecast.
termsTitle

